


Introduction
Contents
- Introduction
- Editor’s Choice
- General Radio Listeners Statistics
- By Region
- By Share Of Listening Time By Medium
- By Demographics
- By The Time Of The Day
- By Americans Listen To Music By Age
- By Preferred Radio Content By Genre
- By Hours Of Listening
- By Country
- American Radio Listeners’ statistics
- By Global Radio Ad Spend
- Change In Media Consumption Habits
- Popularity Of Radio
- Radio Listenership in India By Frequency
- Conclusion
Radio Listeners Statistics: Radio has been a popular form of entertainment for generations. Before TV, computers, and the internet, radios were the main source of music, news, and podcasts. Now, radios are built into mobile phones and are available everywhere. Radio content is free, which makes it attractive compared to subscription platforms.
The radio industry plays a significant role in supporting businesses by offering advertising opportunities. Unlike other modern entertainment mediums, radio engages a broad audience including users from every generation.
According to Nielsen Media Research data published by the Radio Advertising Bureau, about eight in ten Americans ages 12 and older tune into terrestrial radio weekly. The rate has remained stable over the past two years, with 82% of Americans in this age group listening in 2022. There was a slight decline in listenership from 89% in 2019 to 83% in 2020, likely influenced by the U.S. coronavirus outbreak, but the numbers indicate a resilient interest in traditional radio broadcasting.
Editor’s Choice
- Every week, 92% of Americans tune into the radio.
- Around 70% of US residents listened to the radio during an average week in 2023, an increase from 67% in 2022.
- The preferred types of radio content in the US in 2023 were country music and rock/alternative or indie music, each attracting 43% of listeners.
- The Asian radio market is predicted to reach USD 4.0 billion by 2024, with a compound annual growth rate (CAGR) of 1.04% from 2024 to 2028.
- By 2024, China is expected to generate the highest radio market revenue, estimated at USD 2,136 million.
- More than half of radio listeners in the US come from every age group and gender.
- Argentina has the highest number of radio listeners by weekly hours, with an average of 20.8 hours.
- The projected revenue per person in the Asian radio market in 2024 is USD 0.89, with an expected volume growth of 2.0% in 2025.
- By 2028, the volume of radio units in the American region is projected to reach 73.0 million, with a growth of 0.5% in 2025.
- Americans listen to the radio more frequently than they use Facebook each week.
- In the US, 55% of Gen Z listen to AM/FM radio daily.
- Adults listen to radio for an average of 104 minutes per day or 12.2 hours per week.
- The radio industry is expanding through smart speakers and online listening, with 100 million Americans owning a smart speaker.
- Radio is considered the most trustworthy among all advertising channels.
- 77% of listeners are likely to try a brand or product recommended by their favorite radio personality.
- It usually takes 2.4 days for listeners of audio ads to take action.
- Global radio advertising spending reaches USD 36.1 billion annually.
- The average cost of a radio advertisement in the largest US cities is USD 513.40.
- 47% of listeners feel that radio ads are a fair trade for their listening time.
- In a January 2022 survey, 71% of respondents in India said they never listened to the radio, while only about 4% listened daily.
- By 2029, the number of radio users is expected to reach 3.2 billion.
- User penetration is forecasted to be 39.9% in 2024, remaining stable until 2029.
- The average revenue per user (ARPU) in the radio industry is expected to be USD 11.44.
- The US is poised to generate the highest radio revenue, amounting to USD 12,480.00 million in 2024.
- About 70% of radio listeners tune in for between 30 minutes to 2 hours daily.
- 74% of radio listeners tune in more than three days every week, with about 25% being regular decision-makers who listen daily.
General Radio Listeners Statistics
- In 2023, around 70% of US residents tuned into radio during an average week, compared to 67% in 2022.
- As of 2023, there were around 4,185 AM (amplitude modulation) stations in the USA.
- Every month, around 82 million Americans tune into AM stations. Furthermore, AM has more old-age listeners than FM has younger listeners.
- Radio Listeners Statistics state that every week, 92% of Americans listen to the radio.
- Every day, 7 in 10 radio listeners listen to the radio for at least 30 minutes to 2 hours.
- 74% of radio listeners listen to the radio at least 3 days a week.
- Furthermore, 1 out of 4 radio listeners stated, that tuning to radio every day has become a part of their everyday lives.
- According to Radio Listeners Statistics, 6 out of 10 listeners tune in at home.
- Compared to Facebook users every day, Americans are more likely to tune in to radio, contributing 293 million.
- Radio Listeners Statistics by Demographics 2023 states, on average an adult listens to the radio at least 104 minutes per day, making it 12.2 hours every week.
- 46% of radio listeners are more likely to purchase the advertised product on the radio.
- By 2027, Radio’s local spot Ad market is estimated to grow at a CAGR of 5% reaching $9.03 billion.
- The most popular medium of communication in the USA is radio, as 95% of Americans tune into radios.
- In the USA, more than 244 million individuals listen to the radio every week.
- In America, individuals who listen to the radio for more than 16 hours per week are aged more than 12 years
- On average, nearly 50% of radio listeners are likely to follow their favorite personality on radio for around 8 years.
- Radio Listeners Statistics 2023 by the impact of radio shows following data, favorite personality speaking on the radio makes listeners feel less alone (44%), value and trust their favorite personality’s opinions (80%), and are more likely to buy the recommended product by favorite influencers (77%).
- According to a report of the Consumer audio market by Deloitte in 2024, around 50% of people globally (4 billion) will tune into radio.
- Furthermore, in the current year, annual revenues for every listener will result in $10.50.
- In terms of worldwide entertainment segment, radio is predicted to generate $42 billion in revenue while other segments will generate as follows audiobooks $7 billion, streaming music $23 billion, and podcasts $3.5 billion, all of which are expected to generate more than $75 billion of revenue in 2024.
- Radio Listeners Statistics show that, on average, an American listens to the radio for 1 hour and 39 minutes a day.
- The most popular day of the week to tune into radio listening is Thursday.
- As per Radio Listeners Statistics 2023, the monthly reach of FM or AM radio is more than other music platforms including non-subscription and subscription-based.
- 44% of individuals prefer to listen to the radio in the car, while 19% are at work, and 2% listen to other places.
- 65% of the time is allotted to listening to the radio while away from home and going shopping or purchasing.
By Region
Worldwide
- As of 2024, the worldwide Radio market is projected to be valued at $9.3 billion.
- In global comparison, china is expected to generate the highest revenue in 2024 resulting in $2,136 million.
- The worldwide radio market is estimated to grow at a CAGR of 1.09% from 2024 to 2028.
- In 2024, the per-person volume on average is estimated to be 0.1 pieces.
- The volume of the radio market is projected to reach 0.4 billion pieces by 2028.
- By 2025, the growth of volume is projected to be at 1.4%.
Asia
- The Asian Radio market is expected to reach $4.0 billion in 2024 and grow at a CAGR of 1.04% between 2024 and 2028.
- Furthermore, the volume is projected to reach 215.8 million pieces by 2028.
- The per-person revenue is expected to amount to $0.89 in 2024. Moreover, the volume is projected to grow by 2.0% in 2025.
Americas
- The American radio market is valued at $2.9 billion in 2024 and is expected to grow at a CAGR of 0.35% between 2024 and 2028.
- The per-person revenue in the American market is expected to be valued at $2.80 in 2024.
- By 2028, the volume is projected to reach 73.0 million pieces units with a growth of 0.5% in 2025.
Africa
- Between 2024 and 2028, the African radio market is expected to grow at a CAGR of 4.03%.
- In 2024, it is valued at $0.7 billion.
- Furthermore, the per-person revenues are estimated to amount to $0.54 in the current year.
- By 2028, volume is expected to reach 46.5 million pieces, with a volume growth rate of 2.4% in 2025.
Australia And Oceania
- As of 2024, the Australian and Oceania market is valued at $97.8 million and is expected to grow at a CAGR of 0.50% between 2024 and 2028.
- The per capita revenue is projected to amount to $2.25 in 2024.
- In 2025, the volume growth is projected at 0.2%.
Europe
- In 2024, the European market is projected to generate a revenue of $1.6 billion, and between 2024 and 2028 it is expected to grow at a CAGR of 1.08%.
- By 2028, the volume is estimated to reach 57.3 million pieces with a volume growth of 0.1% in 2025.
| Medium | Share of Listening Time |
|---|---|
| Radio | 41% |
| Streaming Audio | 18% |
| Owned Music | 10% |
| YouTube Music | 9% |
| SiriusXM | 9% |
| Podcasts | 6% |
| TV Music Channels | 4% |
| Others | 3% |
(Source: soocial.com)
- The listening percentage for content on the radio is higher as compared to other mediums of audio entertainment contributing 41%.
- Streaming audio, and owned music contributes 18% and 10% of listening time.
- YouTube Music, SiriusXM 9% each, Podcasts 6%, TV music channels 4% and others 3% are other contributions towards listening time.
By Demographics
- Predictions of 2025 state that, individuals aged between 18 to 34 years are more likely to start listening to the radio as compared to watching TV.
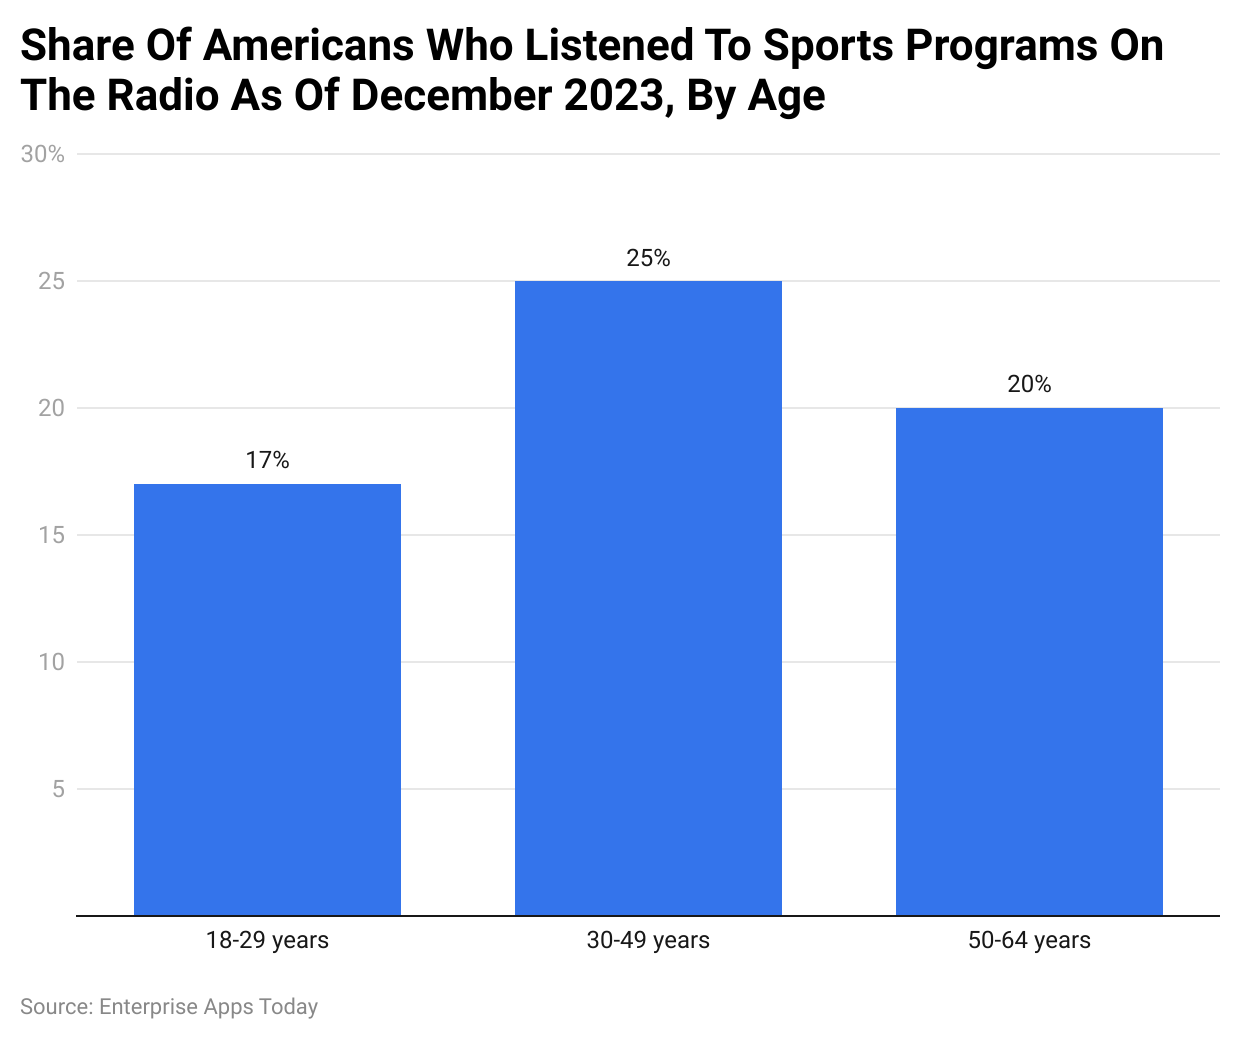
By Share Of Americans Who Listened To Sports Programs
 (Reference: statista.com)
- As of December 2023, the majority of the Americans who listened to sports programs on the radio belonged to the age group 30 to 49 years resulting in 25%, followed by 50 to 64 years 20% and 18 to 29 years 17%.
By Weekly Reach By Age And Gender
| Age group | Persons | Men | Women |
| 12+ | 82% | 81.9% | 82% |
| 12-17 | 75.2% | 73.5% | 76.9% |
| 18+ | 82.7% | 82.8% | 82.5% |
| 18-24 | 73% | 71.4% | 74.7% |
| 18-34 | 76.1% | 74.8% | 77.7% |
| 18-49 | 80.2% | 79.3% | 81.1% |
| 25-54 | 83.2% | 82.8% | 83.7% |
| 35-64 | 86.8% | 87.2% | 86.5% |
| 55+ | 84.9% | 86.7% | 83.3% |
| 65+ | 82.2% | 84.2% | 80.5% |
(Source: statista.com)
- Radio Listeners Statistics 2023 shows that in the USA, there are more than 50% of radio listeners belong to every age group irrespective of their gender. However, older men are more likely to listen to the radio.
By The Time Of The Day
| Age group | 6 a.m. – 10 a.m. | 10 a.m. – 3 p.m. | 3 p.m. – 7 p.m. | 7 p.m. – midnight |
| Persons 12+ | 58.3% | 67.8% | 66.1% | 40.2% |
| Persons 12-17 | 50% | 50.9% | 58.4% | 36.5% |
| Persons 18+ | 59.1% | 69.5% | 66.9% | 40.5% |
| Persons 18-24 | 44.2% | 56.2% | 56.2% | 38.8% |
| Persons 18-34 | 48.8% | 59% | 59.6% | 39.1% |
| Persons 18-49 | 55.4% | 64% | 64.6% | 41.4% |
| Persons 25-54 | 60.1% | 67.7% | 68.2% | 42.9% |
| Persons 35-64 | 65.6% | 73.5% | 72.7% | 44.6% |
| Persons 55+ | 62.3% | 75.7% | 68.3% | 38% |
| Persons 65+ | 58.4% | 74.1% | 63.8% | 33.7% |
| Men 12+ | 58.5% | 67.2% | 65.9% | 40.6% |
| Men 12-17 | 48.2% | 48.4% | 55.8% | 33.9% |
| Men 18+ | 59.5% | 69.1% | 66.9% | 41.3% |
(Source: statista.com)
- The majority of the adults aged 18+ tune into the radio between 10 am to 3 pm resulting in 69.5%. On average, individuals spend the almost whole day and night listening to the radio every day starting from 6 am to midnight.
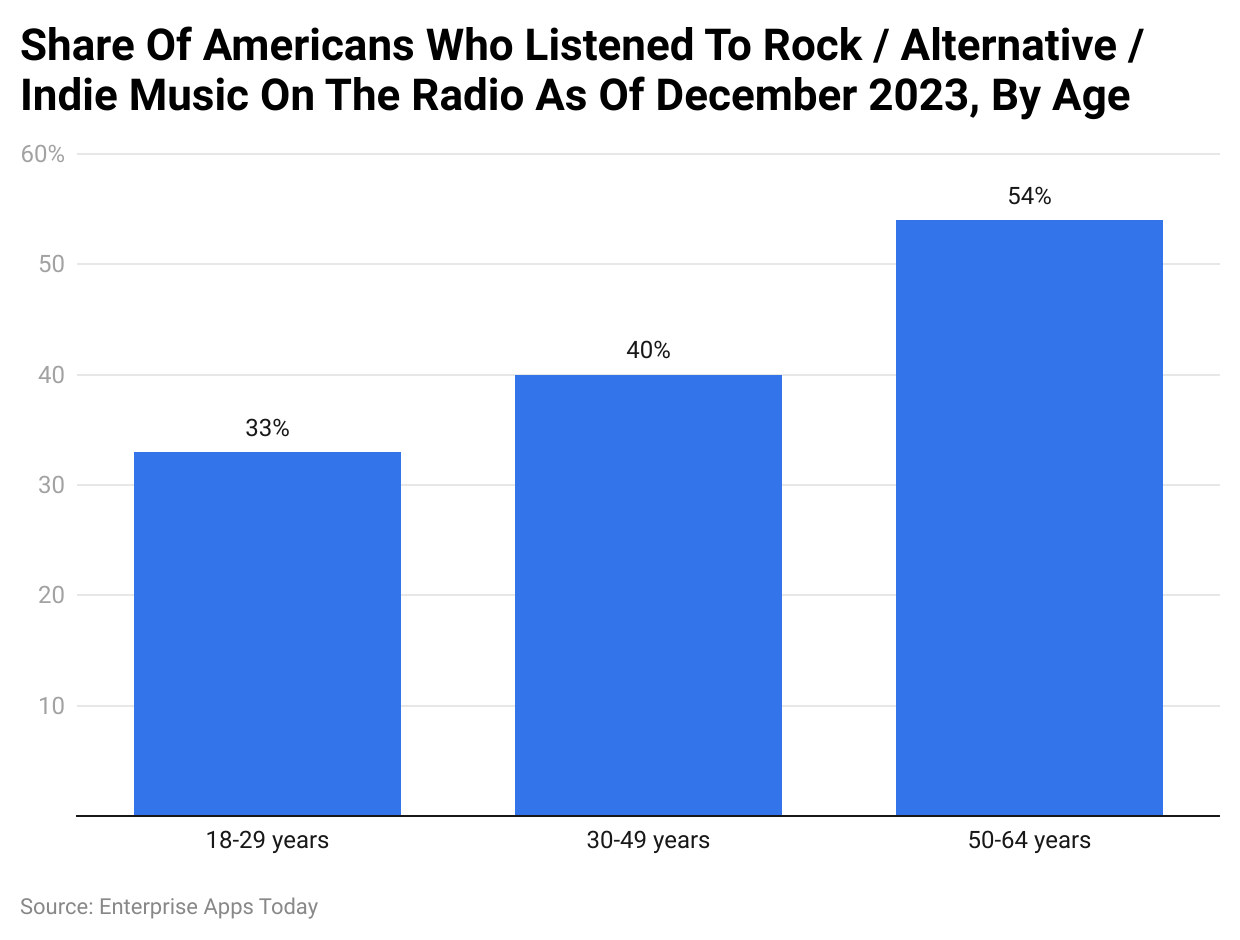
By Americans Listen To Music By Age
 (Reference: statista.com)
- As of December 2023, the highest number of Americans who listened to rock/ alternative or indie music belonged to the age group 50 to 64 years resulting in 54%, followed by 30 to 49 years (40%) and 18 to 29 years (33%).
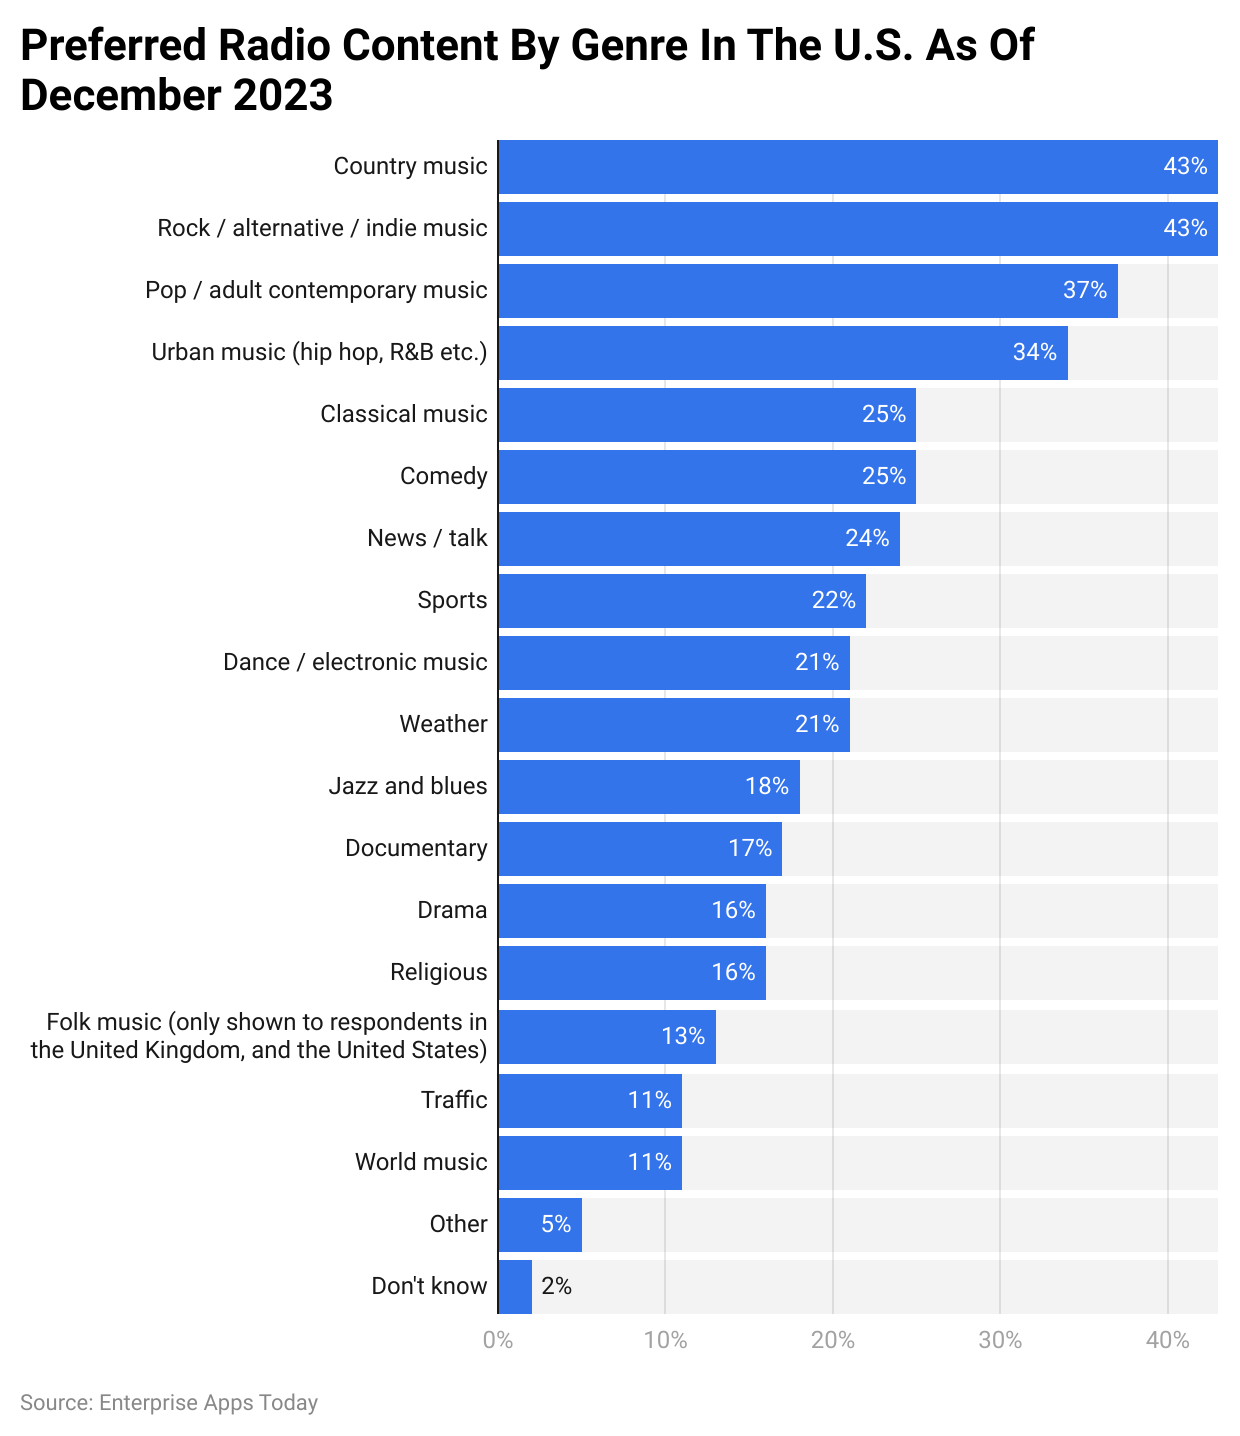
By Preferred Radio Content By Genre
 (Reference: statista.com)
- In 2023, country music and rock/ alternative or indie music were Americans’ most preferred radio content types, contributing 43% of listeners each. On average, the top 10 preferred content types on radios included a variety of music, weather, sports, comedy, and news.
By Hours Of Listening
| Ages 18-34 | Ages 35-49 | Ages 50-64 | Ages 65+ |
| 9.4 h/week | 11.9 h/week | 14.6 h/week | 13.3 h/week |
(Source: musicalpursuits.com)
- In 2023, the majority of the listeners who tuned into radios for at least 14.6 hours a week were aged between 50 to 64 years. The older generation listens for at least 13.3 hours a week who are aged 65 years and above.
- On the other hand, the younger generation (18 to 34 years) listens to the radio 9.4 hours a week, while listeners aged between 35 to 49 years tune in 11.9 hours a week.
By Country
| Country |
Weekly Hours Spent Listening
|
|
| 1 | Argentina | 21 |
| 2 | Brazil | 17.2 |
| 3 | South Africa | 15 |
| 4 | Czech Republic | 13.5 |
| 5 | Thailand | 13.3 |
| 6 | Turkey | 13.3 |
| 7 | Poland | 12.5 |
| 8 | Hungary | 12.1 |
| 9 | Germany | 11.5 |
| 10 | Australia | 11.3 |
(Source: aneki.com)
- The highest number of radio listeners by weekly hours spent listening reside in Argentina, resulting in 20.8 hours a week. Brazil and South Africa are other leading countries with the highest hours spent tuning to radios, contributing 17.2 and 15 hours respectively.
American Radio Listeners’ statistics
- Radio remains the most popular medium in the U.S., reaching 88% of the population each week. This equals about 293 million Americans tuning into AM/FM radio regularly.
| Radio Listeners 2021 |
Radio Listeners 2020 |
Radio Listeners 2019 |
Radio Listeners 2009 |
| 88% of Americans | 83% of Americans | 89% of Americans | 92% of Americans |
- More Americans listen to the radio weekly than those who use Facebook, with radio attracting 293 million listeners compared to Facebook’s 180 million users.
- Despite advancements in digital media, radio’s popularity persists. Data show a slow decline in terrestrial radio listenership since 2009, but it still maintains strong reach post-pandemic lockdowns.
- Radio is not just for older generations; it’s popular among young people too. About 55% of Gen Z, aged 13 to 24, listen to AM/FM radio every day.
| Radio Reach in the U.S. | Through Traditional Radio | Through Streaming Radio |
| 55% of Gen Z | 89% of Gen Z | 11% of Gen Z |
- Most of Gen Z’s radio listening (89%) happens through traditional radio receivers, not online streams.
- Radio also has a significant reach among older age groups, with 92% of Americans aged 50 to 64 tuning in, while about 84% of Millennials listen to the radio.
| Medium | Weekly Reach Ages 18+ |
Weekly Reach Ages 18-34 |
Weekly Reach Ages 35-49 |
Weekly Reach Ages 50-64 |
Weekly Reach Ages 65+ |
| Radio | 88% | 84% | 90% | 92% | 85% |
| TV | 86% | 74% | 88% | 92% | 93% |
| Social Media sphn. | 81% | 87% | 88% | 80% | 64% |
| Streaming Audio sphn. | 56% | 71% | 63% | 50% | 36% |
- About 88% of American adults tune into the radio for an average of 12.2 hours each week or 104 minutes daily. Most people listen while commuting.
| Terrestrial Radio |
App/web on Tablet |
App/web on Smartphone |
Live and Time-Shifted TV |
| 12.2 h/week | 10.7 h/week | 20 h/week | 30.8 h/week |
- Radio remains popular across various age groups, with those aged 50-64 listening the most, at about 14.6 hours per week. The least frequent listeners are young adults aged 18-34, who listen for about 9.4 hours weekly.
- Compared to radio, adults spend more time with other media: 10.7 hours on tablet apps and the web, 20 hours on smartphone apps and web, and 30.8 hours watching live or time-shifted TV each week.
| Ages 18-34 | Ages 35-49 | Ages 50-64 | Ages 65+ |
| 9.4 h/week | 11.9 h/week | 14.6 h/week | 13.3 h/week |
- On average, 15% of daily time in the U.S. population is devoted to radio listening. Since many people listen to the radio while engaging in other activities, such as driving or gardening, the actual listening time might be higher than reported.
- Radio is the most trusted advertising medium, with Nielsen reporting the highest share of trust among all advertising channels.
- Adults between 35-49 years trust radio ads the most at 60%, followed closely by those aged 18-34 at 54%.
| Platforms | Trustworthiness Ages 18-34 |
Trustworthiness Ages 35-49 |
Trustworthiness Ages 50+ |
| AM/FM Radio | 54% | 60% | 51% |
| TV | 51% | 59% | 51% |
| Apps & Websites | 45% | 53% | 40% |
| Social Media | 39% | 43% | 25% |
- TV ads also hold significant trust, with 59% of adults aged 35-49 and 51% of those aged 18-34 finding them reliable.
- According to Audacy’s 2021 research, audio channels are considered the most trustworthy media source, capturing 69% of listener trust.
| Audio | TV | Social Media | |
| 69% of Trust | 64% of Trust | 57% of Trust | 56% of Trust |
- Apps and websites are trusted by 45% of adults, while social media ads are deemed reliable by 39%.
- The trust in radio and TV ads likely stems from their long-standing presence in daily life, such as during drives or in living rooms.
- The statistics indicate that people are more likely to trust and act on advertisements from familiar voices heard on audio platforms.
By Global Radio Ad Spend
- Global radio advertising spending is currently valued at USD 36.1 billion per year.
- This market is expected to grow slightly to USD 36.2 billion by 2023.
| Radio Ad Spend 2020 | Radio Ad Spend 2021 | Radio Ad Spend 2022f | Radio Ad Spend 2023f |
| $30.1 Billions | $35.4 Billions | $36.1 Billions | $36.2 Billions |
- Radio advertising spending has rebounded to pre-pandemic levels, showing a strong recovery.
- During the COVID-19 pandemic, radio advertising declined by 9.5%, which was less severe than the 14.8% decline seen in other linear media.
- The Average Revenue Per User (ARPU) for the radio industry is predicted to be USD 11.94 in 2022.
- ARPU figures are expected to remain stable into 2023, with a slight increase to USD 11.95 per listener.
| ARPU in 2020 | ARPU in 2021 | ARPU in 2022f | ARPU in 2023f |
| $11.29 per Listener | $11.81 per Listener | $11.94 per Listener | $11.95 per Listener |
- The United States is anticipated to generate the highest radio ad revenue, amounting to USD 12 billion.
- Dentsu’s research anticipates further growth in radio ad revenue as mobility returns and digital channels continue to evolve.
- On average, a 30-second radio ad in the largest U.S. cities costs USD 513.40.
- The cost of radio ads can differ greatly based on factors such as station location, ad frequency, and ad type.
- In New York, the most expensive city for radio ads, the average cost is USD 1,405.00, while in San Antonio, the least expensive, it’s just USD 81.00.
| City | Avg. Ad Rate | Population |
| New York, NY | $1,405.00 | 8.8 Million |
| Los Angeles, CA | $1,083.00 | 3.9 Million |
| Chicago, IL | $362.00 | 2.7 Million |
| Houston, TX | $264.00 | 2.3 Million |
| Phoenix, AZ | $168.00 | 1.6 Million |
| Philadelphia, PA | $383.00 | 1.6 Million |
| San Antonio, TX | $81.00 | 1.4 Million |
| San Diego, CA | $193.00 | 1.3 Million |
| Dallas, TX | $296.00 | 1.3 Million |
| San Jose, CA | $899.00 | 1.0 Million |
- The difference in ad costs between New York and San Antonio is 17 times, reflecting the disparity in their populations—New York has six times more people.
- Radio advertising offers a strong return on investment, with each dollar spent potentially generating between USD 9.48 and USD 23.21 in sales.
| Retail | Dept. Stores | Telecom | Home Impr. |
| $23.21 Return | $17.00 Return | $14.00 Return | $9.48 Return |
- Retail campaigns have the highest return, earning up to USD 23.21 for each dollar spent, demonstrating radio’s effectiveness in marketing.
- Nielsen’s research indicates that 80% of all U.S. credit card purchases are tracked to gauge the effectiveness of radio campaigns.
- The U.S. has over 15,445 commercial radio stations, a significant increase from the number in 1970.
| Radio Stations in the U.S. |
Leading Radio Company |
Leading Radio Format |
| 15,445 | iHeartRadio | Country |
- iHeartRadio is the leading radio company in the U.S., owning 863 stations.
- Country music is the most popular radio format in the nation.
- Radio continues to have a significant reach, with 83.1% of high-income men tuning in weekly.
| Ads on NPR (National Public Radio) |
Ads on AM/FM Radio |
Ads on TV/Streaming Video |
| 51% Agree | 47% Agree | 36% Agree |
- Nearly half of all radio listeners, at 47%, think that listening to ads is a fair exchange for free content.
- According to National Public Radio, 51% of its listeners agree that ads are acceptable during their listening time.
- On AM/FM radio, this sentiment is slightly lower, with 47% of listeners accepting ads as part of the experience.
- For TV and streaming video, only 36% of viewers are okay with ads.
- This suggests that radio listeners are more open to ads compared to those who watch TV or use streaming services.
- Many people use paid music streaming services mainly to avoid ad interruptions.
- A significant number of radio listeners, 46%, have considered trying new products or services after hearing about them in radio ads.
- Overall, the most frequent radio users are often the most receptive to advertisements.
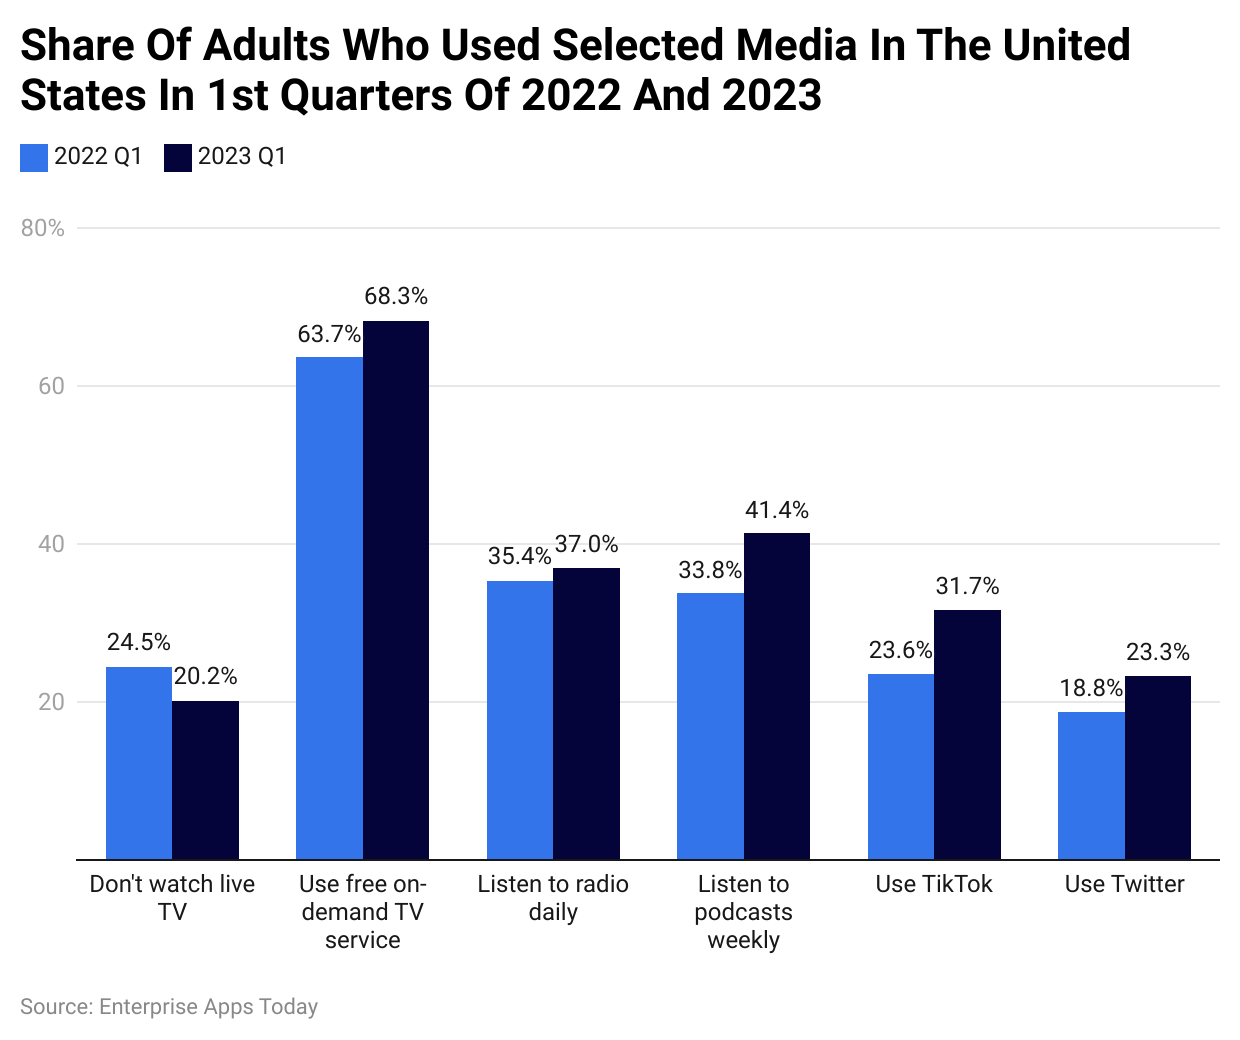
Change In Media Consumption Habits
 (Reference: statista.com)
- In Q1 of 2023, more Americans started listening to the radio daily as compared to Q1 of 2022, resulting in 37%. Overall, there is a major change in media consumption habits in the USA in 2023 as seen in the above chart.
Popularity Of Radio
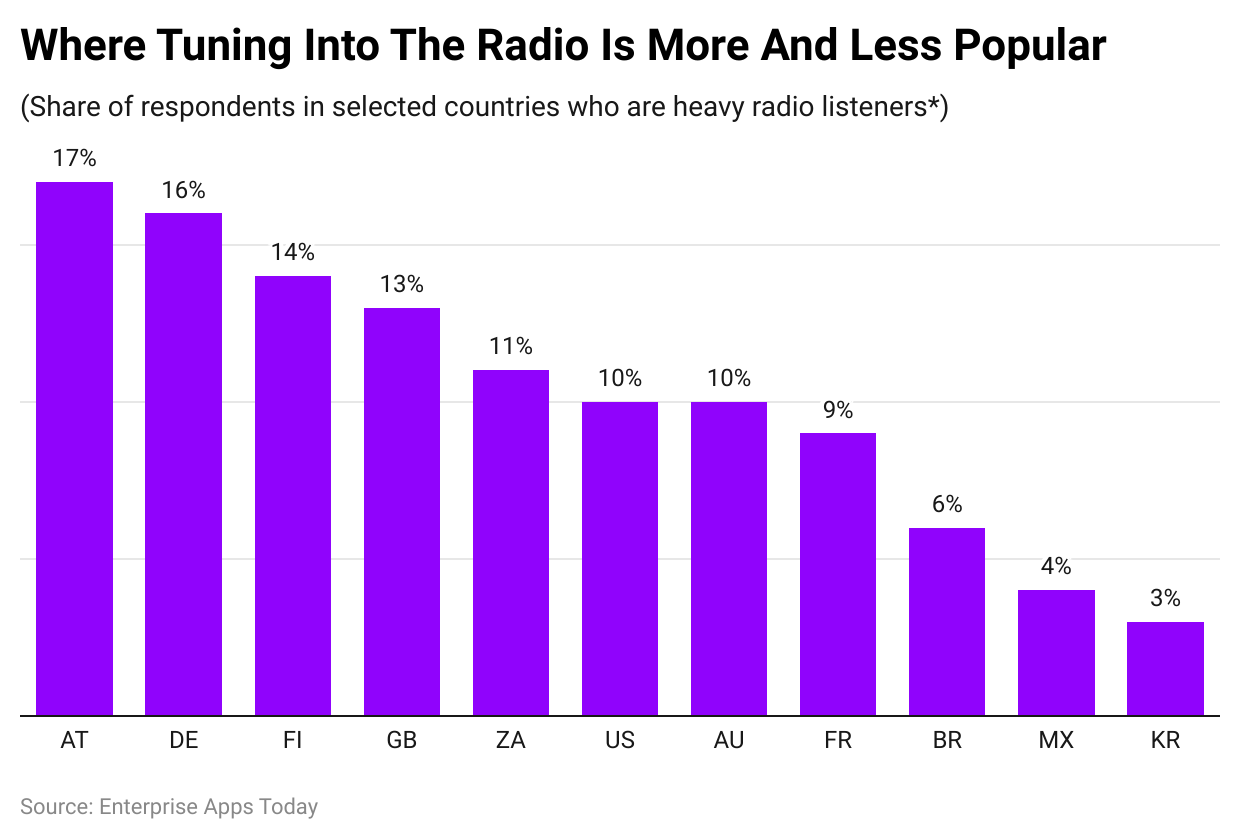 (Reference: statista.com)
Radio Listenership in India By Frequency

- In a survey from January 2022, 71% of people in India said they never listen to the radio.
- Only 4% of respondents reported listening to the radio every day during that period.
- This data highlights a significant decline in daily radio listenership in India.
Conclusion
Radio is not only a source of entertainment but also a means of advertising and communication for brands. As shown in the Radio Listeners Statistics 2024, unlike TV consumers, there is more number of individuals who listen to radio in every generation. With technology, radios are now available on smartphones.
Radio is more effective and has a wider reach. Paying a small amount of money will help businesses reach a greater audience from corners of the world via radio.