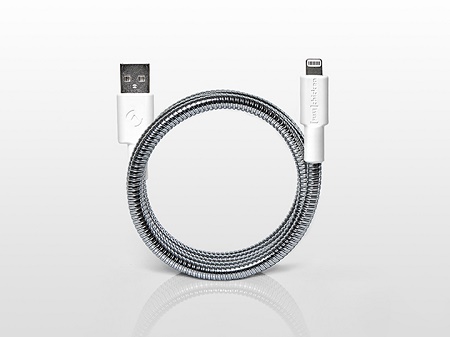
Close Menu
  • News
    • AI
    • Crypto
    • Stock
    • Tech
    • Social Media
  • Statistics
    • Technology and Innovation
    • Companies
    • General
    • Smart Gadgets
    • Software
    • Accessories
    • Work and Productivity
  • PR
Facebook X (Twitter) Instagram
  • Home
  • About
  • Contact Us
  • Privacy Statement
Facebook X (Twitter) LinkedIn
Coolest GadgetsCoolest Gadgets
  • News
    1. AI
    2. Crypto
    3. Stock
    4. Tech
    5. Social Media
    6. View All

    UK Government Denies OpenAI Access to Datasets Amid Criticism Over AI Deal

    July 23, 2025

    Sam Altman Warns AI Could Eliminate Entire Job Categories, Urges Oversight

    July 23, 2025

    Alibaba Enters AI Wearables Race with Smart Glasses Launch This Week

    July 23, 2025

    Tencent Steps into AI Coding with Full-Stack IDE ‘CodeBuddy’ Launch

    July 23, 2025

    Elliptic Launches Industry-First Data Fabric Service for Crypto Intelligence

    June 25, 2025

    Team Heretics Launches First Native Blockchain Wallet Integration in Esports Store

    June 19, 2025

    Bitcoin (BTC) Price: Options Market Skew Turns Positive as Traders Bet on Rebound

    June 17, 2025

    Cardano (ADA) Price: Technical Analysis Shows Testing of Key $0.62 Support Level

    June 17, 2025

    Ola Electric Ltd (OLAELEC.BO)Stock; Gains 18% After Revealing Bold FY26 Sales Targets

    July 14, 2025

    Alibaba Group (BABA) Stock; Climbs 1.27% in Pre-Market After Delivery Record Orders

    July 14, 2025

    CoreWeave, Inc. (CRWV) Stock: Drops 9% After $9B Core Scientific Deal

    July 13, 2025

    Nvidia Corporation (NVDA) Stock: CEO Jensen Huang Sells $36M Amid Soaring Net Worth

    July 13, 2025

    BYD Dominates Hong Kong EV Market with 27% Market Share

    July 23, 2025

    Jack Dorsey Funds Next-Gen Social Media Apps to Break Big Tech’s Grip

    July 17, 2025

    FAW-Alibaba Joint Lab Targets Smarter Cars with Tailored AI Models

    July 16, 2025

    China’s BYD Expands Saudi Footprint Amid Tesla’s Market Entry

    July 14, 2025

    TikTok Launches AI Avatars to Replace Human Influencers in Advertising

    June 16, 2025

    UK Government Denies OpenAI Access to Datasets Amid Criticism Over AI Deal

    July 23, 2025

    Sam Altman Warns AI Could Eliminate Entire Job Categories, Urges Oversight

    July 23, 2025

    Alibaba Enters AI Wearables Race with Smart Glasses Launch This Week

    July 23, 2025

    Tencent Steps into AI Coding with Full-Stack IDE ‘CodeBuddy’ Launch

    July 23, 2025
  • Statistics
    1. Technology and Innovation
    2. Companies
    3. General
    4. Smart Gadgets
    5. Software
    6. Accessories
    7. Work and Productivity
    8. View All

    DJI Statistics By Usage, Industry, Market and Sales Analysis (2025)

    June 13, 2025

    Amazon Echo Statistics By User, Website Traffic, Device Usage And Facts (2025)

    June 13, 2025

    Amazon Echo vs. Google Nest Statistics – Which is Better? (2025)

    June 13, 2025

    HTC Vive vs Oculus Rift Statistics – Which is Better? (2025)

    June 12, 2025

    Apple iPod Statistics By Usage And Revenue (2025)

    June 13, 2025

    Amazon Echo vs. Google Nest Statistics – Which is Better? (2025)

    June 13, 2025

    Fujifilm vs. Panasonic Lumix Statistics – Which is Better? (2025)

    June 13, 2025

    Bose Soundbar vs Sonos Beam Statistics – Which is Better? (2025)

    May 30, 2025

    Generation Alpha Statistics and Facts (2025)

    March 20, 2025

    Technology Addiction Statistics By Demographics, Social Media and Facts

    March 7, 2025

    Social Worker Burnout Statistics By Mental Health, Impacts, Demographics and Facts

    February 28, 2025

    Media And Entertainment Industry Statistics By Region, Market Leaders, Revenue, Usage, Country and Trends

    February 20, 2025

    DJI Statistics By Usage, Industry, Market and Sales Analysis (2025)

    June 13, 2025

    Amazon Echo Statistics By User, Website Traffic, Device Usage And Facts (2025)

    June 13, 2025

    Amazon Echo vs. Google Nest Statistics – Which is Better? (2025)

    June 13, 2025

    Garmin vs. Apple Watch for Fitness Statistics – Which is Better? (2025)

    May 30, 2025

    Slack vs. Ryver Statistics – Which is Better? (2025)

    June 5, 2025

    Notion vs. Evernote Statistics – Which is Better? (2025)

    June 5, 2025

    Ahrefs vs SEMrush Statistics – Which is Better? (2025)

    June 5, 2025

    VS Code vs JetBrains IntelliJ Statistics – Which is Better? (2025)

    June 5, 2025

    Canon vs. Nikon DSLR Statistics – Which is Better? (2025)

    June 2, 2025

    Garmin vs. Apple Watch for Fitness Statistics – Which is Better? (2025)

    May 30, 2025

    Dell XPS vs MacBook Pro Statistics – Which is Better? (2025)

    May 29, 2025

    Samsung vs. Apple Smartphone Statistics – Which is Better? (2025)

    May 28, 2025

    Trello Vs. Asana Statistics – Which Is Better? (2025)

    June 4, 2025

    (Bring Your Own Device) BYOD Statistics By Security, Work, Adoption, Benefits and Facts

    April 9, 2025

    Workforce Automation Statistics and Facts (2025)

    February 28, 2025

    Workplace Distraction Statistics and Facts (2025)

    February 28, 2025

    DJI Statistics By Usage, Industry, Market and Sales Analysis (2025)

    June 13, 2025

    Amazon Echo Statistics By User, Website Traffic, Device Usage And Facts (2025)

    June 13, 2025

    Apple iPod Statistics By Usage And Revenue (2025)

    June 13, 2025

    Chromecast Statistics By Security And Facts (2025)

    June 13, 2025
  • PR
Coolest GadgetsCoolest Gadgets
Statistics

Cable TV Subscribers Statistics By Connection, Viewers, Platforms and Facts

Joseph D'SouzaBy Joseph D'SouzaNovember 11, 2024Updated:December 30, 2024No Comments13 Mins Read
Facebook Twitter Pinterest LinkedIn Tumblr Email
Cable TV Subscribers Statistics

Introduction

Contents

  • Introduction
  • Editor’s Choice
  • What is Cable TV?
  • General Cable TV Subscribers Statistics
  • Count of PAY-TV Households In The US Statistics
  • Cable Connection Subscriber Statistics
  • Most Watched Cable TV Network by Viewers
  • Global Cable TV -Subscribers Statistics
  • Cable TV Penetration Statistics by Platform
  • Cable TV is becoming less valuable
  • US Cable TV Subscribers Statistics
  • Conclusion

Cable TV Subscribers Statistics: In the 1980s and 1990s, many people subscribed to digital cable and satellite services for entertainment and news. However, new technology like on-demand streaming has changed that. Now, many people are moving away from traditional pay TV subscriptions.

Despite this shift, cable TV is still around. Various records show how cable TV is used, its benefits, and the services it offers. These Cable TV Subscribers Statistics can help you see how cable TV has affected the entertainment industry and its subscribers.

Editor’s Choice

  • As of 2024, around 68.7 million people in the United States have cable TV subscriptions.
  • From 2021 to 2023, the number of pay TV subscribers worldwide dropped by about 20 million.
  • As of 2023, the number of cable TV subscribers has fallen to 72.2 million, down from 98.7 million in 2016.
  • The global pay-TV market is expected to grow from USD 184.09 billion in 2022 to USD 209.01 billion by 2030.
  • In the US, there are 1,775 TV stations and about 5,200 cable systems run by 660 companies, reaching 90% of the population.
  • Cable TV Subscribers Statistics stated that Comcast lost 2 million subscribers in 2022, compared to 1.66 million in 2021.
  • Comcast has 17,144,000 subscribers, while Charter has 15,495,000.
  • NBC led in total viewership for 2022 with 5.1 million viewers, just ahead of CBS.
  • Cable TV Subscribers Statistics stated that China has the highest pay TV subscription rate, with 76 subscriptions for every 100 households.
  • Additionally, 69% of the most popular shows on cable TV are sports-related.
  • Finally, more than 80% of people say that the high cost is the main reason they cancel their cable TV subscriptions.

What is Cable TV?

Cable television, also known as cable TV, delivers TV shows to viewers using radio signals sent through coaxial or fibre-optic cables. This allows people to watch TV without needing an antenna. Subscribers usually pay a fee to use cable TV services.

With cable TV, viewers can access many channels, including local stations, national networks, premium channels, and special channels created just for cable companies. This wide selection provides viewers with plenty of choices for shows and content, improving their overall viewing experience.

General Cable TV Subscribers Statistics

  • As of 2023, there are 72.2 million cable TV subscribers, down from 98.7 million in 2016.
  • The global pay-TV market is expected to grow from USD 184.09 billion in 2022 to USD 209.01 billion by 2030, showing steady revenue growth.
  • In the United States, there are 1,775 TV stations and about 5,200 cable systems run by 660 providers, reaching 90% of the population.
  • Comcast lost 2 million subscribers in its cable pay-TV business in 2022, an increase from a loss of 1.66 million in 2021.
  • Cable TV Subscribers Statistics stated that Comcast leads with 17.1 million subscribers, while Charter has 15.5 million.
  • In 2022, NBC attracted 5.1 million viewers, narrowly surpassing CBS in total viewership.
  • Traditional TV now makes up only 28% of media consumption, showing a shift towards digital platforms.

most-watched-cable-tv-networks-by-number-of-viewers (Reference: cablecompare.com)

  • Cable TV viewing is expected to drop by 28% each year, reflecting changing consumer habits. In 2022, only 68% of Americans had cable subscriptions.
  • About 6 million Americans cancelled their cable subscriptions in 2020, showing a significant trend away from traditional TV.
  • In 2022, more than 50% of Americans still preferred cable TV services, suggesting that while streaming options are growing, cable remains a popular choice.
  • Cable TV subscriber statistics show that the US has nearly 1,800 TV stations which provide a wide range of programming.
  • AT&T is a major provider of cable TV services in the US. Adults continue to favor cable over streaming, indicating different preferences among age groups.

global-broadcasting-and-cable-tv-market (Reference: cablecompare.com)

  • Cable TV Subscribers Statistics stated that China has the most cable television users worldwide, followed by Latin America.
  • Sky Europe had over 15 million subscribers in 2023, contributing to significant growth in paid TV subscriptions in the region.
  • Europe has seen a large growth in paid television users, which reflects the global trend toward digital data usage.

Count of PAY-TV Households In The US Statistics

number-of-pay-tv-households-in-the-united-states-from-2019-to-2028 (Reference: statista.com)

Year Traditional pay TV (in millions) Digital pay TV (in millions)

2019

84 10.4
2020 77.5

12.6

2021

71.6 14.1
2022 64.9

15.6

2023

58 18.1
2024 53.3

19.2

2025

49.6 20.1
2026 46.4

20.8

2027

43.4 21.4
2028 40.8

21.9

  • In 2023, there were around 58 million traditional pay-tv households in the United States.
  • This number is expected to fall to below 41 million by 2028. Meanwhile, digital pay TV is becoming more popular.
  • The US has one of the largest pay-TV markets in the world. Although millions of people watch their favourite shows, news, and sports, the pay-TV industry is facing big challenges.
  • Cable TV Subscribers Statistics stated that more viewers are cancelling their cable or satellite subscriptions due to rising prices, fewer choices, and the rise of streaming services.
  • Right now, over 50% of US TV households don’t have a cable, satellite, or telco provider.
  • The trend of cutting cable and changes in how people watch TV are significantly impacting the pay-TV market.
  • In 2023, US pay TV providers lost about 5 million subscribers overall. This decline is also affecting major companies like Charter and Comcast.
  • To make up for these losses, they are starting to explore streaming options, but it’s uncertain if this will be enough to stop the loss of subscribers.

Cable Connection Subscriber Statistics

  • The 2022 cable TV subscriber data shows a 28% drop in paid TV subscriptions from 2018 to 2023.
  • As of 2023, there are about 72 million cable TV subscriptions, down from 98.7 million in 2016.
  • The market is expected to grow from USD 184.09 billion in 2022 to USD 209.01 billion by 2023.
  • Cable TV Subscribers Statistics stated that Comcast lost around 2 million subscribers in 2022, and 82% of adults who stream online find it more entertaining than cable.
  • Still, 48% of people in the US pay for cable, with Comcast having about 17.1 million subscribers.

most-watched-cable-tv-networks-by-number-of-viewers (Reference: enterpriseappstoday.com)

  • American adults report spending 68% of their TV time streaming, while only 28% is on traditional TV, showing a clear preference for streaming.
  • Comcast lost over 2 million subscribers in 2022, compared to a loss of 1.66 million in 2021.
  • Pay TV subscribers in the US are expected to decrease by 28% each year from 2022 to 2026.
  • In 2022, there were about 68.5 million pay-TV households, which is projected to drop to 57.2 million by 2026.
  • Internet TV services now have more subscribers than cable TV, with cable accounting for only 34.4% of subscribers. Streaming usage increased by 32% in 2022, following a 22.6% rise the previous year.
  • The global pay-TV market was worth USD 184.09 billion in 2022, growing at an annual rate of 1.60%. It is expected to reach USD 209.01 billion by 2030.
  • Cable TV subscriber statistics stated that revenue dropped from USD 54.11 billion in 2010 to USD 36.75 billion in 2023, indicating fewer viewers, likely due to the growing popularity of streaming services.
  • In 2022, advertising revenue made up over 75% of the market, thanks to strong cable and satellite access in rural areas. This income is essential for cable networks, which must offer quality content to keep subscribers.
  • In the fourth quarter of 2020, there were about 78.7 million cable TV subscribers in the US, showing that cable still has a large audience despite the rise of streaming.
  • The number of cable TV subscribers reached 105 million in 2010, the highest it has ever been.

Most Watched Cable TV Network by Viewers

most-watched-cable-tv-networks-by-number-of-viewers (Reference: enterpriseappstoday.com)

  • In the above chart, we can see the cable TV networks that were watched the most by the number of viewers.
Network Viewers

FOX NEWS

1337
MSNEC

842

HGTV

698
Investigation Discovery

691

Nick

662
A&E

570

ESPN

553
History

551

CNN

546
food

535

Global Cable TV -Subscribers Statistics

  • The number of digital and analogue cable pay-TV subscribers in Eastern Europe is expected to grow from 65 million in 2018 to 73 million by 2028.
  • However, the number of analogue cable subscribers is predicted to decrease to zero during this time.
  • In 2022, Sky Europe, a British media and telecommunications company, had almost 22.666 million subscribers.
  • Cable TV subscriber statistics stated that the company lost about 26,000 subscribers in the first half of 2021.
  • By the second quarter of 2022, cancellations rose sharply to 361,000, which brought Sky’s European subscriber count down to 22.666 million by the end of Q2 2022.

(Reference: ibisworld.com)

Year Annual Change (%)
1980 18.1 million
1981 22.5 million
1982 28.2 million
1983 31.4 million
1984 34.5 million
1985 36.7 million
1986 39.7 million
1087 42.6 million
1988 45.7 million
1989 49.3 million
1990 51.7 million
1991 53.4 million
1992 55.2 million
1993 57.2 million
1994 59.5 million
1995 61.6 million
1996 63.0 million
1997 64.2 million
1998 66.5 million
1999 70.8 million
2000 45.7 million
2001 75.1 million
2002 81.4 million
2003 85.4 million
2004 88.5 million
2005 90.8 million
2006 93.9 million
2007 98.0 million
2008 102.0 million
2009 104.1 million
2010 104.7 million
2011 105.0 million
2012 104.6 million
2013 103.2 million
2014 102.8 million
2015 100.9 million
2016 100.4 million
2017 98.7 million
2018 96.3 million
2019 93.4 million
2020 88.6 million
2021 83.8 million
2022 80.0 million
2023 76.0 million
2024 72.2 million
  • In 2020, the pay-TV industry in Latin America generated over USD 14.3 billion, exceeding the expected USD 14.1 billion from 2019.
  • It’s projected to reach USD 14.9 billion in 2023 and spike even higher by 2024.
  • By 2029, worldwide pay TV revenue is expected to drop by USD 26 million.

number-of-cable-tv-subscription-annual-change (Reference: ibisworld.com)

  • While digital pay-TV subscribers in Eastern Europe are expected to increase, analog cable subscriptions will disappear.
  • Sky Europe has seen a decline in its European customer base due to cancellations. In contrast, pay-TV revenue in Latin America is set to rise significantly by 2024. Still, overall, global pay TV revenue has been decreasing since 2016 and will likely continue to fall through 2028.

Cable TV Penetration Statistics by Platform

us-homes-by-platform (Reference: enterpriseappstoday.com)

  • As of 2022, pay cable TV subscriptions in the United States are expected to drop by 50% by the end of 2024.
  • In 2022, the number of subscribers was:

#1. 1 million for free DTT (Digital Terrestrial Television)

#2. 9 million for free satellite

#3. 9 million for pay satellite

#4. 6 million for IPTV (Internet Protocol Television)

#5. 7 million for digital cable

  • By 2023, the expected number of subscriptions was:

#1. 3 million for free DTT

#2. 3 million for free satellite

#3. 9 million for pay satellite

#4. 4 million for IPTV

#5. 3 million for digital cable

  • By the end of 2024, the projected subscriptions will be:

#1. 7 million for free DTT

#2. 3 million for free satellite

#3. 4 million for pay satellite

#4. 3 million for IPTV

#5. 4 million for digital cable

Cable TV is becoming less valuable

  • A recent study from CordCutting.com found that while the average number of channels in a cable package has decreased since 2019, the average monthly bill has increased significantly—from USD 96 to USD 147.
  • That's a 52% jump in just three years, raising the cost per channel from USD 0.50 to USD 0.77.
  • This increase is three times higher than the rate of inflation, which is concerning for people trying to be mindful of their entertainment budgets.
  • Even more alarming, the study showed that nearly all the channels in an average cable TV package go unwatched.

cable-is-becoming-less-valuable (Reference: research.mountain.com)

  • Even though viewers can access nearly 200 channels, the average person only watches about 15.
  • This means that 92% of channels go unwatched, making cable TV's already high-cost feT.V. even more expensive.
  • With a monthly bill of USD 147 for just 15 channels, the real cost per channel is USD 9.57, which is higher than or similar to the prices of popular streaming services.
  • In fact, for less than one-third of the cost of a cable TV biT.V., consumers could subscribe to all the major streaming services and still watch their favorite broadcast and cable shows on platforms like Hulu, Paramount+, Peacock, and HBO Max.

Cost-of-streaming-vs.-Cable-TV (Source: research.mountain.com)

  • As a result, the average consumer wastes USD 135 every month—or USD 1,618 a year—on channels they don't watch.
  • For those who watch even fewer than 15 channels, the amount they waste keeps going up.

the-true-cost-of-cable-tv (Reference: research.mountain.com)

US Cable TV Subscribers Statistics

  • Cable TV subscribers Statistics stated that almost 48% of Americans get their TV through cable or satellite.
  • The quality of local TV channels clearly affects how many Americans keep cable.
  • The US U.S.1,775 television stations.
  • There are also about 5,200 cable systems run by 660 providers, reaching 90% of the population.
  • However, more people are exploring other options.

number-of-pay-tv-households-in-the-united-states-from-2013-to-2027 (Reference: enterpriseappstoday.com)

  • By 2024, 101.5 million people are expected to cut the cord, and by 2026, that number will increase to 112.9 million, making up 41.6% of the US population.
  • The number of people in the US who will cancel their cable or satellite subscriptions is projected to rise to 95.1 million by 2023, up from 87 million in 2022.
  • The following table shows the US Cord-Cutter 2022 – 2026
Years Number of Cord Cutters in millions Percentage of the Population in the US
20U.S. 112.9 41.6
2025 107.4 39.8
2024 101 37.9
2023 95.1 35.9
2022 87 33.1
  • In 2023, Xfinity will be the biggest cable TV service provider in the US.
  • Stomers will pay about 18% more for the same TV channels, and fees for TV services, equipment, regional sports, broadcasts, modem rentals, and internet services will significantly increase.
  • Cable TV Subscribers Statistics stated that Cable revenue grew by 1.4% to USD 16.64 billion, just missing analysts’ prediction of USD 16.67 billion.
  • At the same time, NBCU’s advertising sales increased by 4% to USD 2.86 billion, and revenue from theme parks went up by 12% to USD 2.11 billion.
  • 81% of people aged 65 and older have a cable TV subscription in the US.

US-traditional-Pay-TV-Households-2022-2027 (Source: emarketer.com)

  • The majority of cable TV subscribers, around 63%, are 68 years or older. Those aged 47-67 make up 55% of the remaining subscribers, while people aged 37-48 account for 48%.
  • Cable TV subscribers Statistics stated that the smallest group of cable TV subscribers is the 18-37 age group, with only 46%, as they usually prefer other options like streaming services.

Conclusion

In conclusion, Cable TV Subscriber Statistics gives us important insights into the changing TV industry. The drop in cable TV subscribers, along with the increasing preference for digital streaming, shows that cable providers need to adjust their strategies to stay competitive in a rapidly changing market. Despite these challenges, the cable TV market is expected to reach USD 209.01 billion worldwide by 2030, creating chances for innovation and growth. With 82% of US US citizens finding internet TV more entertaining than cable, it's clear that consumer preferences are shifting toward digital options.

However, since 48% of Americans still pay for cable TV services, there is still a large audience to reach. Market research analysts play a key role in understanding these trends, helping businesses navigate the industry's complexities and take advantage of new opportunities. As the landscape continues to evolve, a solid understanding of Cable TV Subscriber Statistics will be essential for companies to thrive in the digital age.

Share. Facebook Twitter Pinterest LinkedIn Tumblr Email
Joseph D'Souza
  • Website
  • Facebook
  • Instagram
  • LinkedIn

Joseph D'Souza started Coolest Gadgets in 2005 to share his love for tech gadgets. It has since become a popular tech blog, famous for detailed gadget's reviews and companies statistics. Joseph is committed to providing clear, well-researched content, making tech easy to understand for everyone. Coolest Gadgets is a trusted source for tech news, loved by both tech fans and beginners.

Related Posts

DJI Statistics By Usage, Industry, Market and Sales Analysis (2025)

June 13, 2025

Amazon Echo Statistics By User, Website Traffic, Device Usage And Facts (2025)

June 13, 2025

Apple iPod Statistics By Usage And Revenue (2025)

June 13, 2025
Add A Comment

Comments are closed.

UK Government Denies OpenAI Access to Datasets Amid Criticism Over AI Deal

AI July 23, 2025

TLDRs; UK government faces backlash over lack of clarity in its AI agreement with OpenAI.…

Sam Altman Warns AI Could Eliminate Entire Job Categories, Urges Oversight

July 23, 2025

Alibaba Enters AI Wearables Race with Smart Glasses Launch This Week

July 23, 2025

Tencent Steps into AI Coding with Full-Stack IDE ‘CodeBuddy’ Launch

July 23, 2025

Coolest-Gadgets

Founded in 2005, Coolest-Gadgets.com is a trusted source for news & data-driven insights on technology, gadgets, and industry trends. We provide free, in-depth statistical data on electronics, innovation, companies, productivity, and more—helping readers make informed decisions.

Site Links
  • Laptop Statistics
  • iPhone Statistics
  • Apple Watch Statistics
  • iPhone Vs. Android Statistics
  • Popular Google Doodle Games
  • Coca-Cola Statistics
  • McDonald’s Statistics
  • Tinder Statistics
  • Yelp Statistics
  • Linux Statistics
Site Links
  • About
  • Privacy Policy
  • Terms and Conditions
  • GDPR Policy
  • Expert Peer Review Process
  • Editorial Guidelines
  • Disclaimer
  • Privacy Statement
  • Contact Us
Categories
  • Gadgets
  • Companies
  • Smart Gadgets
  • Accessories
  • Gaming
  • Media and Entertainment
  • Software
  • Health and Fitness
  • Finance
  • E-Commerce and Retail
  • Household
  • Statistics
Coolest-Gadgets™ Copyright © 2005 - 2025 Kooc Media Ltd. All rights reserved. Registered Company No.05695741
Network: Moneycheck - Finance News / Blockonomi - Crypto News / CoinCentral - Crypto News

Type above and press Enter to search. Press Esc to cancel.